Articles Hello, Auto!
The statistic that made robotaxis look safe is the same one hiding their worst failures
A crashes-per-million-miles average is built to describe the ordinary mile; the correlated, high-consequence failures that draw regulators cluster in the miles it cannot see.
22 July 2026
On the evening of 4 July, San Francisco's Presidio filled with fireworks, crowds and, within an hour, dozens of stranded robotaxis. Some ran flat out of charge mid-journey. Others simply stopped, unsure what to do with the sudden crush of pedestrians, road closures and noise. In one widely shared clip, a driverless car rolls calmly over a detonating firework while its passenger asks, audibly nervous, whether the car is on fire. By the time the night was over, around 64 vehicles needed a tow truck or a member of staff to retrieve them, and in two cases, actual first responders had to get behind the wheel themselves to move stalled cars out of the way.
Four days later, the National Highway Traffic Safety Administration wrote to autonomous vehicle developers with unusually blunt language. It had identified, the agency said, a "clear pattern" of driverless vehicles interfering with first responders: blocking ambulances and fire engines, driving into active emergency scenes, failing to recognise flashing lights, flares, smoke or a simple traffic cone. It gave the industry until the end of July to show up with solutions.
The average mistake
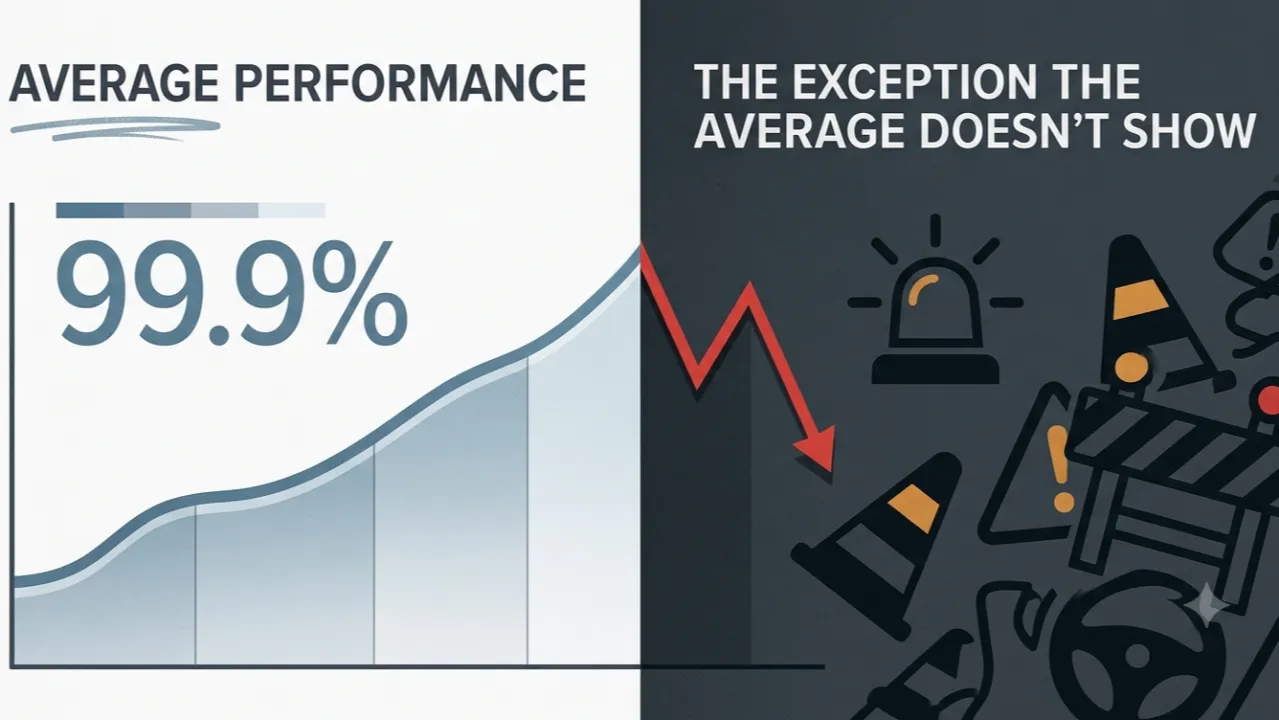
Here is the part that should make any senior engineering or strategy audience sit up. The same company at the centre of that letter also publishes some of the most reassuring safety statistics in the entire automotive industry. Across more than 220 million rider-only miles, it reports 94% fewer crashes causing serious or fatal injury than human drivers face over the same distance in the same cities, and 90% fewer serious-injury-or-worse crashes overall. Both things are true at once: an extraordinary aggregate safety record, and a "clear pattern" serious enough to draw a federal ultimatum. That is not a contradiction. It is a lesson in what averages are and are not built to see.
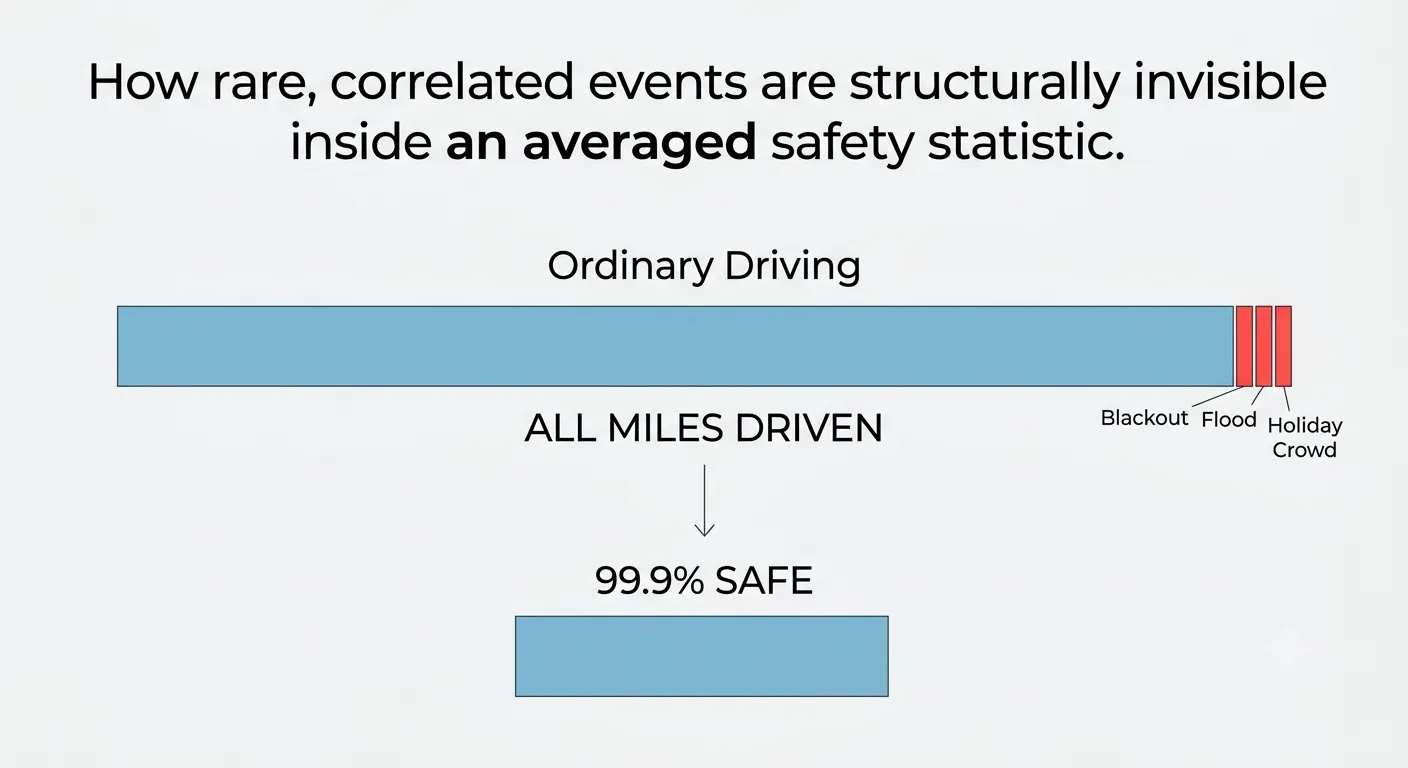
A crashes-per-million-miles figure is, by construction, dominated by the overwhelming majority of miles that are utterly uneventful: a green light, an empty lane, a car ahead maintaining a steady speed. Averaged over hundreds of millions of such miles, even a real and repeated category of failure barely moves the needle, provided it is rare enough as a proportion of total distance travelled. The trouble is that the failures regulators, journalists and the public actually care about are not randomly distributed across all those miles. They cluster: around blackouts, storms, holiday crowds, construction zones, anything that pushes a road environment outside its ordinary operating envelope. A statistic built to describe the average mile will always look excellent, right up until the exact moment it needs to describe an unusual one.
Difference in human-machine judgement
This is not a one-off embarrassment. In December 2025, a power outage knocked out roughly seven thousand traffic signals across San Francisco. Robotaxis stalled at intersections and blocked arterial roads, and, by the company's own account, a sudden spike in requests for remote human confirmation overwhelmed its fleet response team, delaying exactly the intervention meant to prevent this sort of gridlock. In the spring, a car that drove into floodwater in San Antonio triggered a recall; the fix restricted where the vehicles were allowed to operate rather than fixing how they judged water depth, and within weeks, renewed flooding forced fresh suspensions across six cities because the workaround depended on weather warnings that arrived too late. Separately, and still under formal investigation by the National Transportation Safety Board, robotaxis have twice been caught passing stopped school buses during pupil loading, despite two rounds of fixes meant to have solved it. Different failure modes, different root causes, but the same shape: rare, correlated, high-consequence, and largely invisible to a metric measured in crashes per million miles.
Structural bottleneck
The common thread running underneath all of this is remote assistance, the human-in-the-loop safety net every driverless operator relies on to handle situations the automated system cannot. It works well enough when incidents are isolated and infrequent. It becomes a genuine liability precisely when many vehicles need it at once, which is exactly what happens during a blackout, a flash flood or a fireworks-night crowd surge. A safety architecture built around occasional human intervention is, by definition, weakest at the moments when correlated failures are most likely, which is also when the consequences of failure are highest.
Rare to routine
None of this is unique to one company's engineering. It is a scaling problem familiar to anyone who has built a large, distributed, real-time system: as the fleet grows from a few hundred vehicles to several thousand, scenarios that were genuinely rare become routine simply because there are enough vehicles for the tail of the distribution to show up every week. It is worth noting, too, that regulators are not only questioning what the aggregate statistics fail to capture. Weeks before the first-responder letter, two US senators separately asked NHTSA to independently verify a rival manufacturer's public safety claims, arguing that comparing new vehicles against an entire ageing vehicle fleet, and comparing unlike categories of crash, produces a number that flatters the manufacturer without describing anything real. Put those two regulatory threads together and the message is unambiguous: the industry's safety statistics are being challenged from both directions simultaneously, on whether the average is measured honestly, and on whether an honest average was ever the right thing to measure in the first place.
This piece first appeared in ASG's Hello, Auto! newsletter on LinkedIn.